
Now it was time for some tools. Program piece tools, not whole-program tools. I was going to be generating lots of vector fields, for several purposes, so I'd better have a way to store them.
Simple and stupid is best. A text file containing the dimensions (as ASCII integers), followed by the data values (as ASCII decimal numbers.) One value per line. That's a field. Since my purposes included color (a triple value), vector (double), and density (scalar), I made the field a three-dimensional array.
I wrote up the field object: constructor, destructor, accessor macro, text file read and write methods, and (why not) a method to set the field to a constant value.
To experiment with complicated field-generating tools, I would obviously need a source of simple fields. And a way to view them. A simple constant program was no trouble -- that just created a field (of specified dimensions), set it to a constant value, and dumped it out as a file. For viewing, I wrote topnm, which read a field and dumped out an image, in PNM format. (PNM is very simple -- in fact, just about identical to my field file format, with integers or bytes instead of decimal numbers. There are plenty of Unix tools to manipulate PNM images, view them, and convert them to other formats.) Converting a scalar field to an image produces greyscale; fields of depth two and three are converted to color, using the red, green, and blue components. Easy.
(To make it even easier, I then wrote a shell script fv that ran topnm and then xview. Now I could display any field on my screen with a two-letter command. Trivial hack, but I'm trying to approach completeness here... if asymptotically.)
Constant fields in hand, I set to work on the business of scattering strokes around an image. This, you recall, was built on boustrophedon error-diffusion (Floyd-Steinberg) dithering. I had the source code of the PNM dithering tool as a template, so I quickly patted something into shape. Lo! The makelist tool, which converted a constant field into a list of stroke coordinates, randomly but evenly spaced.
Ought to be, at least. I needed a way to view them. I had a way to view fields, via PNM, but not lists of coordinates.
(Although a list of coordinates could be represented as a 1xN field of double values... I didn't in fact store it that way, although I could have. It didn't feel right. It would have taken extra code to count how many coordinates there would be, before generating the field. And it wouldn't have helped, anyway. I wanted to view the list as discrete dots in a two-D image, not a long thin streak of rainbow noise.)
Oh, a note about the dithering. I had some notion that the resolution of the field, that is its size, ought to be easily variable. I would be starting with a mathematical figure, after all, and ending with a resolution-independent PostScript file. I should be able to do the work in-between at any resolution. Perhaps lower for draft work, and higher for final work.
But dithering is inherently a pixel-oriented job. Dither a higher-resolution image, and you get more dots (which are smaller.) So I rigged makelist to brighten or dim its input field in proportion with its area. That way, if you passed in a double-sized field, you'd get the same number of dots out; they'd just be more smoothly distributed.
(In the worst case, for a small input field, the number of dots out would equal the number of pixels in the field. Then it would be brightened to pure white, and every possible dot would be turned on -- a perfectly regular square grid of dots. See? Larger input fields produce better output. But not too large. I found that about 0.25 density was good.)
Back to the track: I needed a way to view dot-lists. Time to start on the makeps program. This would eventually be the final link in the tool-chain, generating the PostScript artwork files in their final form. But I could add that functionality one step at a time. For now, it just had to read a list of dots, and draw them as, well, dots. Little black circles.
PostScript for little black circles is easy. ("x y radius 0 360 arc fill", if you're interested.)


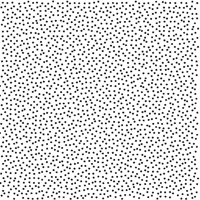
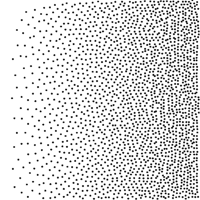
My first PS results of the Tarot project looked pretty good. Evenly distributed dots. I wrote some quick scaffolding to make fields with gradations, and they looked pretty good too.