(The designers have a stats page, but it's way out of date, and it doesn't have this chart anyhow.)
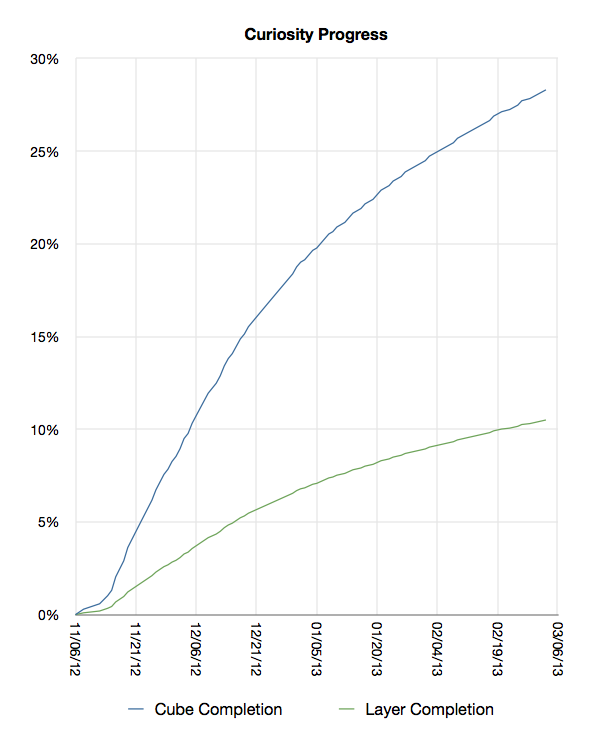
What are we looking at? The cube started with an edge length of 4096, meaning that it will take 2048 cleared layers to reach the center. I yoinked progress data from Wikipedia up through yesterday, at which time 215 layers had been cleared. That's slightly over 10%, and the progress rate is charted on the lower (green) line.
But wait! Each layer is slightly smaller than the last, so the layers get easier to clear as time passes. We should really be charting volume progress, rather than the number of layers. By that measure (upper blue line), almost 30% of the cube is gone.
When the thing started up, I was prepared to believe that the designers wouldn't crank it through all the way -- they could have declared any layer the "last layer". But at this point, they can easily wait it out. Progress is slowing, but it should still be done by the end of the year.
Data snarfed from Wikipedia page: List of Curiosity layers. But see also the discussion in this blog post, which infers that the designers "glitched" the cube size up by one -- presumably so that there would be a single center cubelet. (I have not adjusted the chart for that possibility; the difference would not be visible anyhow.)
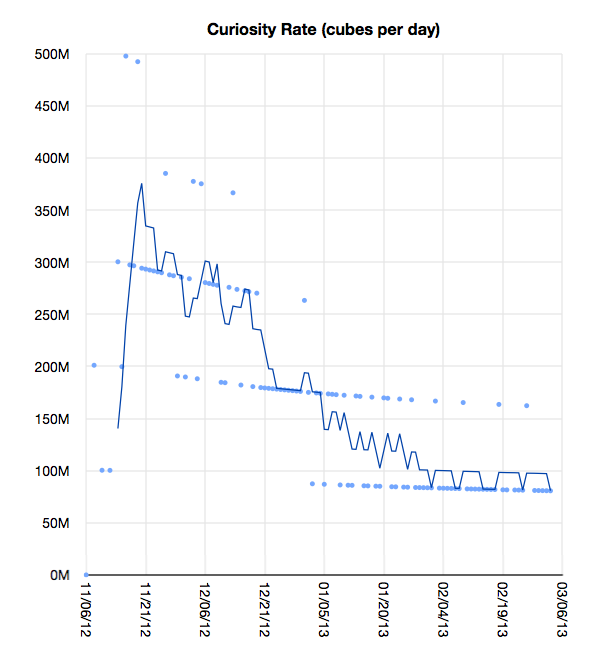
The data is noisy because the Wikipedia data is in days per layer, and then I filter that down to layers per day, so each dot represents a jump of N layers (1 through 5). The line graph is a running five-day average, which should be enough to give an idea of the true rate.
So, is this real? Are people really clearing roughly 80 million cubes per day? (That's not 80 million taps, since the bonus tools let you knock off many cubes in a single tap.)
I have no way to estimate whether 80 million cubes in a day is plausible. If the creators are fudging the numbers, they're doing a good job; the clearing patterns look human-generated. I suppose they could be recording them and playing them back, but surely somebody would have recognized their own donger graffiti from an earlier day!
These charts are still through March 3. In April I'll grab another block of data.
(Someone also pointed out this graphing site, posted by @monkeyboson. Requires Javascript.)
Thoughts of Days ( <-- Previous and Next --> Thought)